遇见连接超时
问题现象
写了一个每天执行两次的定时任务,该任务会分批对线上所有几百个租户生成《平安通告》,上线1个多月后突然手机收到告警,某几个用户生成失败。
  1
2
3
4
5
6
7
8
9
10
11
12
13
14
15
16
17
18
19
20
21
22
23
24
25
26
27
28
29
30
31
32
33
34
35
36
37
38
39
40
41
42
43
44
45
46
47
48
49
50
51
52
53
54
55
56
57
58
59
60
61
62
63
64
65
66
67
68
69
70
71
72
73
74
75
76
77
78
79
80
81
82
83
84
85
86
87
88
89
90
91
92
93
94
95
96
97
98
99
100
101
102
103
104
105
106
107
108
109
110
111
112
113
114
115
116
117
118
119
120
2024-10-17 17:00:10,125 [safetyNoticeGenerator8] ERROR [com.alibaba.druid.pool.DruidDataSource] DruidDataSource.java:1988 - {conn-110021} discard
 org.postgresql.util.PSQLException: An I/O error occurred while sending to the backend.
   at org.postgresql.core.v3.QueryExecutorImpl.execute(QueryExecutorImpl.java:395)
   at org.postgresql.jdbc.PgStatement.executeInternal(PgStatement.java:498)
   at org.postgresql.jdbc.PgStatement.execute(PgStatement.java:415)
   at org.postgresql.jdbc.PgPreparedStatement.executeWithFlags(PgPreparedStatement.java:190)
   at org.postgresql.jdbc.PgPreparedStatement.execute(PgPreparedStatement.java:177)
   at com.alibaba.druid.pool.DruidPooledPreparedStatement.execute(DruidPooledPreparedStatement.java:483)
   at org.apache.shardingsphere.driver.jdbc.core.statement.ShardingSpherePreparedStatement$2.executeSQL(ShardingSpherePreparedStatement.java:439)
   at org.apache.shardingsphere.driver.jdbc.core.statement.ShardingSpherePreparedStatement$2.executeSQL(ShardingSpherePreparedStatement.java:435)
   at org.apache.shardingsphere.infra.executor.sql.execute.engine.driver.jdbc.JDBCExecutorCallback.execute(JDBCExecutorCallback.java:95)
   at org.apache.shardingsphere.infra.executor.sql.execute.engine.driver.jdbc.JDBCExecutorCallback.execute(JDBCExecutorCallback.java:75)
   at org.apache.shardingsphere.infra.executor.kernel.ExecutorEngine.syncExecute(ExecutorEngine.java:135)
   at org.apache.shardingsphere.infra.executor.kernel.ExecutorEngine.serialExecute(ExecutorEngine.java:121)
   at org.apache.shardingsphere.infra.executor.kernel.ExecutorEngine.execute(ExecutorEngine.java:115)
   at org.apache.shardingsphere.infra.executor.sql.execute.engine.driver.jdbc.JDBCExecutor.execute(JDBCExecutor.java:65)
   at org.apache.shardingsphere.infra.executor.sql.execute.engine.driver.jdbc.JDBCExecutor.execute(JDBCExecutor.java:49)
   at org.apache.shardingsphere.driver.executor.DriverJDBCExecutor.doExecute(DriverJDBCExecutor.java:156)
   at org.apache.shardingsphere.driver.executor.DriverJDBCExecutor.execute(DriverJDBCExecutor.java:145)
   at org.apache.shardingsphere.driver.jdbc.core.statement.ShardingSpherePreparedStatement.execute(ShardingSpherePreparedStatement.java:402)
   at com.zaxxer.hikari.pool.ProxyPreparedStatement.execute(ProxyPreparedStatement.java:44)
   at com.zaxxer.hikari.pool.HikariProxyPreparedStatement.execute(HikariProxyPreparedStatement.java)
   at org.apache.ibatis.executor.statement.PreparedStatementHandler.query(PreparedStatementHandler.java:65)
   at org.apache.ibatis.executor.statement.RoutingStatementHandler.query(RoutingStatementHandler.java:80)
   at jdk.internal.reflect.GeneratedMethodAccessor49.invoke(Unknown Source)
   at java.base/jdk.internal.reflect.DelegatingMethodAccessorImpl.invoke(DelegatingMethodAccessorImpl.java:43)
   at java.base/java.lang.reflect.Method.invoke(Method.java:568)
   at org.apache.ibatis.plugin.Plugin.invoke(Plugin.java:61)
   at jdk.proxy2/jdk.proxy2.$Proxy207.query(Unknown Source)
   at org.apache.ibatis.executor.SimpleExecutor.doQuery(SimpleExecutor.java:65)
   at org.apache.ibatis.executor.BaseExecutor.queryFromDatabase(BaseExecutor.java:333)
   at org.apache.ibatis.executor.BaseExecutor.query(BaseExecutor.java:158)
   at org.apache.ibatis.executor.CachingExecutor.query(CachingExecutor.java:110)
   at com.baomidou.mybatisplus.extension.plugins.MybatisPlusInterceptor.intercept(MybatisPlusInterceptor.java:81)
   at org.apache.ibatis.plugin.Plugin.invoke(Plugin.java:59)
   at jdk.proxy2/jdk.proxy2.$Proxy206.query(Unknown Source)
   at jdk.internal.reflect.GeneratedMethodAccessor44.invoke(Unknown Source)
   at java.base/jdk.internal.reflect.DelegatingMethodAccessorImpl.invoke(DelegatingMethodAccessorImpl.java:43)
   at java.base/java.lang.reflect.Method.invoke(Method.java:568)
   at org.apache.ibatis.plugin.Invocation.proceed(Invocation.java:49)
   at com.github.yulichang.interceptor.MPJInterceptor.intercept(MPJInterceptor.java:76)
   at org.apache.ibatis.plugin.Plugin.invoke(Plugin.java:59)
   at jdk.proxy2/jdk.proxy2.$Proxy206.query(Unknown Source)
   at org.apache.ibatis.session.defaults.DefaultSqlSession.selectList(DefaultSqlSession.java:154)
   at org.apache.ibatis.session.defaults.DefaultSqlSession.selectList(DefaultSqlSession.java:147)
   at org.apache.ibatis.session.defaults.DefaultSqlSession.selectList(DefaultSqlSession.java:142)
   at jdk.internal.reflect.GeneratedMethodAccessor109.invoke(Unknown Source)
   at java.base/jdk.internal.reflect.DelegatingMethodAccessorImpl.invoke(DelegatingMethodAccessorImpl.java:43)
   at java.base/java.lang.reflect.Method.invoke(Method.java:568)
   at org.mybatis.spring.SqlSessionTemplate$SqlSessionInterceptor.invoke(SqlSessionTemplate.java:425)
   at jdk.proxy2/jdk.proxy2.$Proxy189.selectList(Unknown Source)
   at org.mybatis.spring.SqlSessionTemplate.selectList(SqlSessionTemplate.java:224)
   at com.baomidou.mybatisplus.core.override.MybatisMapperMethod.executeForMany(MybatisMapperMethod.java:166)
   at com.baomidou.mybatisplus.core.override.MybatisMapperMethod.execute(MybatisMapperMethod.java:77)
   at com.baomidou.mybatisplus.core.override.MybatisMapperProxy$PlainMethodInvoker.invoke(MybatisMapperProxy.java:152)
   at com.baomidou.mybatisplus.core.override.MybatisMapperProxy.invoke(MybatisMapperProxy.java:89)
   at jdk.proxy2/jdk.proxy2.$Proxy197.findDistinctCiIdsByIdentityId(Unknown Source)
   at com.xxx.xxxcloud.manage.service.safety.notice.impl.xxServiceImpl.addAlertData(xxServiceImpl.java:612)
   at com.xxx.xxxcloud.manage.service.safety.notice.impl.xxServiceImpl.lambda$setJsonField$5(xxServiceImpl.java:368)
   at java.base/java.util.ArrayList.forEach(ArrayList.java:1511)
   at com.xxx.xxxcloud.manage.service.safety.notice.impl.xxServiceImpl.setJsonField(xxServiceImpl.java:346)
   at com.xxx.xxxcloud.manage.service.safety.notice.impl.xxServiceImpl.batchCreate(xxServiceImpl.java:201)
   at java.base/jdk.internal.reflect.NativeMethodAccessorImpl.invoke0(Native Method)
   at java.base/jdk.internal.reflect.NativeMethodAccessorImpl.invoke(NativeMethodAccessorImpl.java:77)
   at java.base/jdk.internal.reflect.DelegatingMethodAccessorImpl.invoke(DelegatingMethodAccessorImpl.java:43)
   at java.base/java.lang.reflect.Method.invoke(Method.java:568)
   at org.springframework.aop.support.AopUtils.invokeJoinpointUsingReflection(AopUtils.java:343)
   at org.springframework.aop.framework.ReflectiveMethodInvocation.invokeJoinpoint(ReflectiveMethodInvocation.java:196)
   at org.springframework.aop.framework.ReflectiveMethodInvocation.proceed(ReflectiveMethodInvocation.java:163)
   at org.springframework.aop.framework.CglibAopProxy$CglibMethodInvocation.proceed(CglibAopProxy.java:751)
   at org.springframework.transaction.interceptor.TransactionInterceptor$1.proceedWithInvocation(TransactionInterceptor.java:117)
   at org.springframework.transaction.interceptor.TransactionAspectSupport.invokeWithinTransaction(TransactionAspectSupport.java:391)
   at org.springframework.transaction.interceptor.TransactionInterceptor.invoke(TransactionInterceptor.java:119)
   at org.springframework.aop.framework.ReflectiveMethodInvocation.proceed(ReflectiveMethodInvocation.java:184)
   at org.springframework.aop.framework.CglibAopProxy$CglibMethodInvocation.proceed(CglibAopProxy.java:751)
   at org.springframework.aop.framework.CglibAopProxy$DynamicAdvisedInterceptor.intercept(CglibAopProxy.java:703)
   at com.xxx.xxxcloud.manage.service.safety.notice.impl.xxServiceImpl$$SpringCGLIB$$0.batchCreate(<generated>)
   at com.xxx.xxxcloud.manage.service.safety.notice.impl.SafetyNoticeScheduleServiceImpl.processBatch(SafetyNoticeScheduleServiceImpl.java:194)
   at com.xxx.xxxcloud.manage.service.safety.notice.impl.SafetyNoticeScheduleServiceImpl.lambda$processBatchesInThreadPool$0(SafetyNoticeScheduleServiceImpl.java:112)
   at java.base/java.util.concurrent.FutureTask.run(FutureTask.java:264)
   at java.base/java.util.concurrent.Executors$RunnableAdapter.call(Executors.java:539)
   at java.base/java.util.concurrent.FutureTask.run(FutureTask.java:264)
   at java.base/java.util.concurrent.ThreadPoolExecutor.runWorker(ThreadPoolExecutor.java:1136)
   at java.base/java.util.concurrent.ThreadPoolExecutor$Worker.run(ThreadPoolExecutor.java:635)
   at java.base/java.lang.Thread.run(Thread.java:840)
 Caused by: java.net.SocketTimeoutException: Read timed out
   at java.base/sun.nio.ch.NioSocketImpl.timedRead(NioSocketImpl.java:288)
   at java.base/sun.nio.ch.NioSocketImpl.implRead(NioSocketImpl.java:314)
   at java.base/sun.nio.ch.NioSocketImpl.read(NioSocketImpl.java:355)
   at java.base/sun.nio.ch.NioSocketImpl$1.read(NioSocketImpl.java:808)
   at java.base/java.net.Socket$SocketInputStream.read(Socket.java:966)
   at java.base/sun.security.ssl.SSLSocketInputRecord.read(SSLSocketInputRecord.java:484)
   at java.base/sun.security.ssl.SSLSocketInputRecord.readHeader(SSLSocketInputRecord.java:478)
   at java.base/sun.security.ssl.SSLSocketInputRecord.bytesInCompletePacket(SSLSocketInputRecord.java:70)
   at java.base/sun.security.ssl.SSLSocketImpl.readApplicationRecord(SSLSocketImpl.java:1465)
   at java.base/sun.security.ssl.SSLSocketImpl$AppInputStream.read(SSLSocketImpl.java:1069)
   at org.postgresql.core.VisibleBufferedInputStream.readMore(VisibleBufferedInputStream.java:161)
   at org.postgresql.core.VisibleBufferedInputStream.ensureBytes(VisibleBufferedInputStream.java:128)
   at org.postgresql.core.VisibleBufferedInputStream.ensureBytes(VisibleBufferedInputStream.java:113)
   at org.postgresql.core.VisibleBufferedInputStream.read(VisibleBufferedInputStream.java:73)
   at org.postgresql.core.PGStream.receiveChar(PGStream.java:465)
   at org.postgresql.core.v3.QueryExecutorImpl.processResults(QueryExecutorImpl.java:2155)
   at org.postgresql.core.v3.QueryExecutorImpl.execute(QueryExecutorImpl.java:368)
   ... 82 common frames omitted
 org.springframework.jdbc.UncategorizedSQLException:
 ### Error querying database.  Cause: java.sql.SQLException: Connection is closed
 ### The error may exist in class path resource [mapper/TbxxHealthCheckResultMapper.xml]
 ### The error may involve com.xxx.xxxcloud.manage.mapper.xx.TbxxHealthCheckResultMapper.selectExecuteLatest
 ### The error occurred while executing a query
 ### Cause: java.sql.SQLException: Connection is closed
 ; uncategorized SQLException; SQL state [null]; error code [0]; Connection is closed
   at org.mybatis.spring.MyBatisExceptionTranslator.translateExceptionIfPossible(MyBatisExceptionTranslator.java:93)
   at org.mybatis.spring.SqlSessionTemplate$SqlSessionInterceptor.invoke(SqlSessionTemplate.java:439)
   at java.base/java.lang.Thread.run(Thread.java:840)
 Caused by: java.sql.SQLException: Connection is closed
   at com.zaxxer.hikari.pool.ProxyConnection$ClosedConnection.lambda$getClosedConnection$0(ProxyConnection.java:502)
   at jdk.proxy3/jdk.proxy3.$Proxy173.prepareStatement(Unknown Source)
   at com.zaxxer.hikari.pool.ProxyConnection.prepareStatement(ProxyConnection.java:327)
   at com.zaxxer.hikari.pool.HikariProxyConnection.prepareStatement(HikariProxyConnection.java)
从上面有几个关键信息梳理下异常调用链:
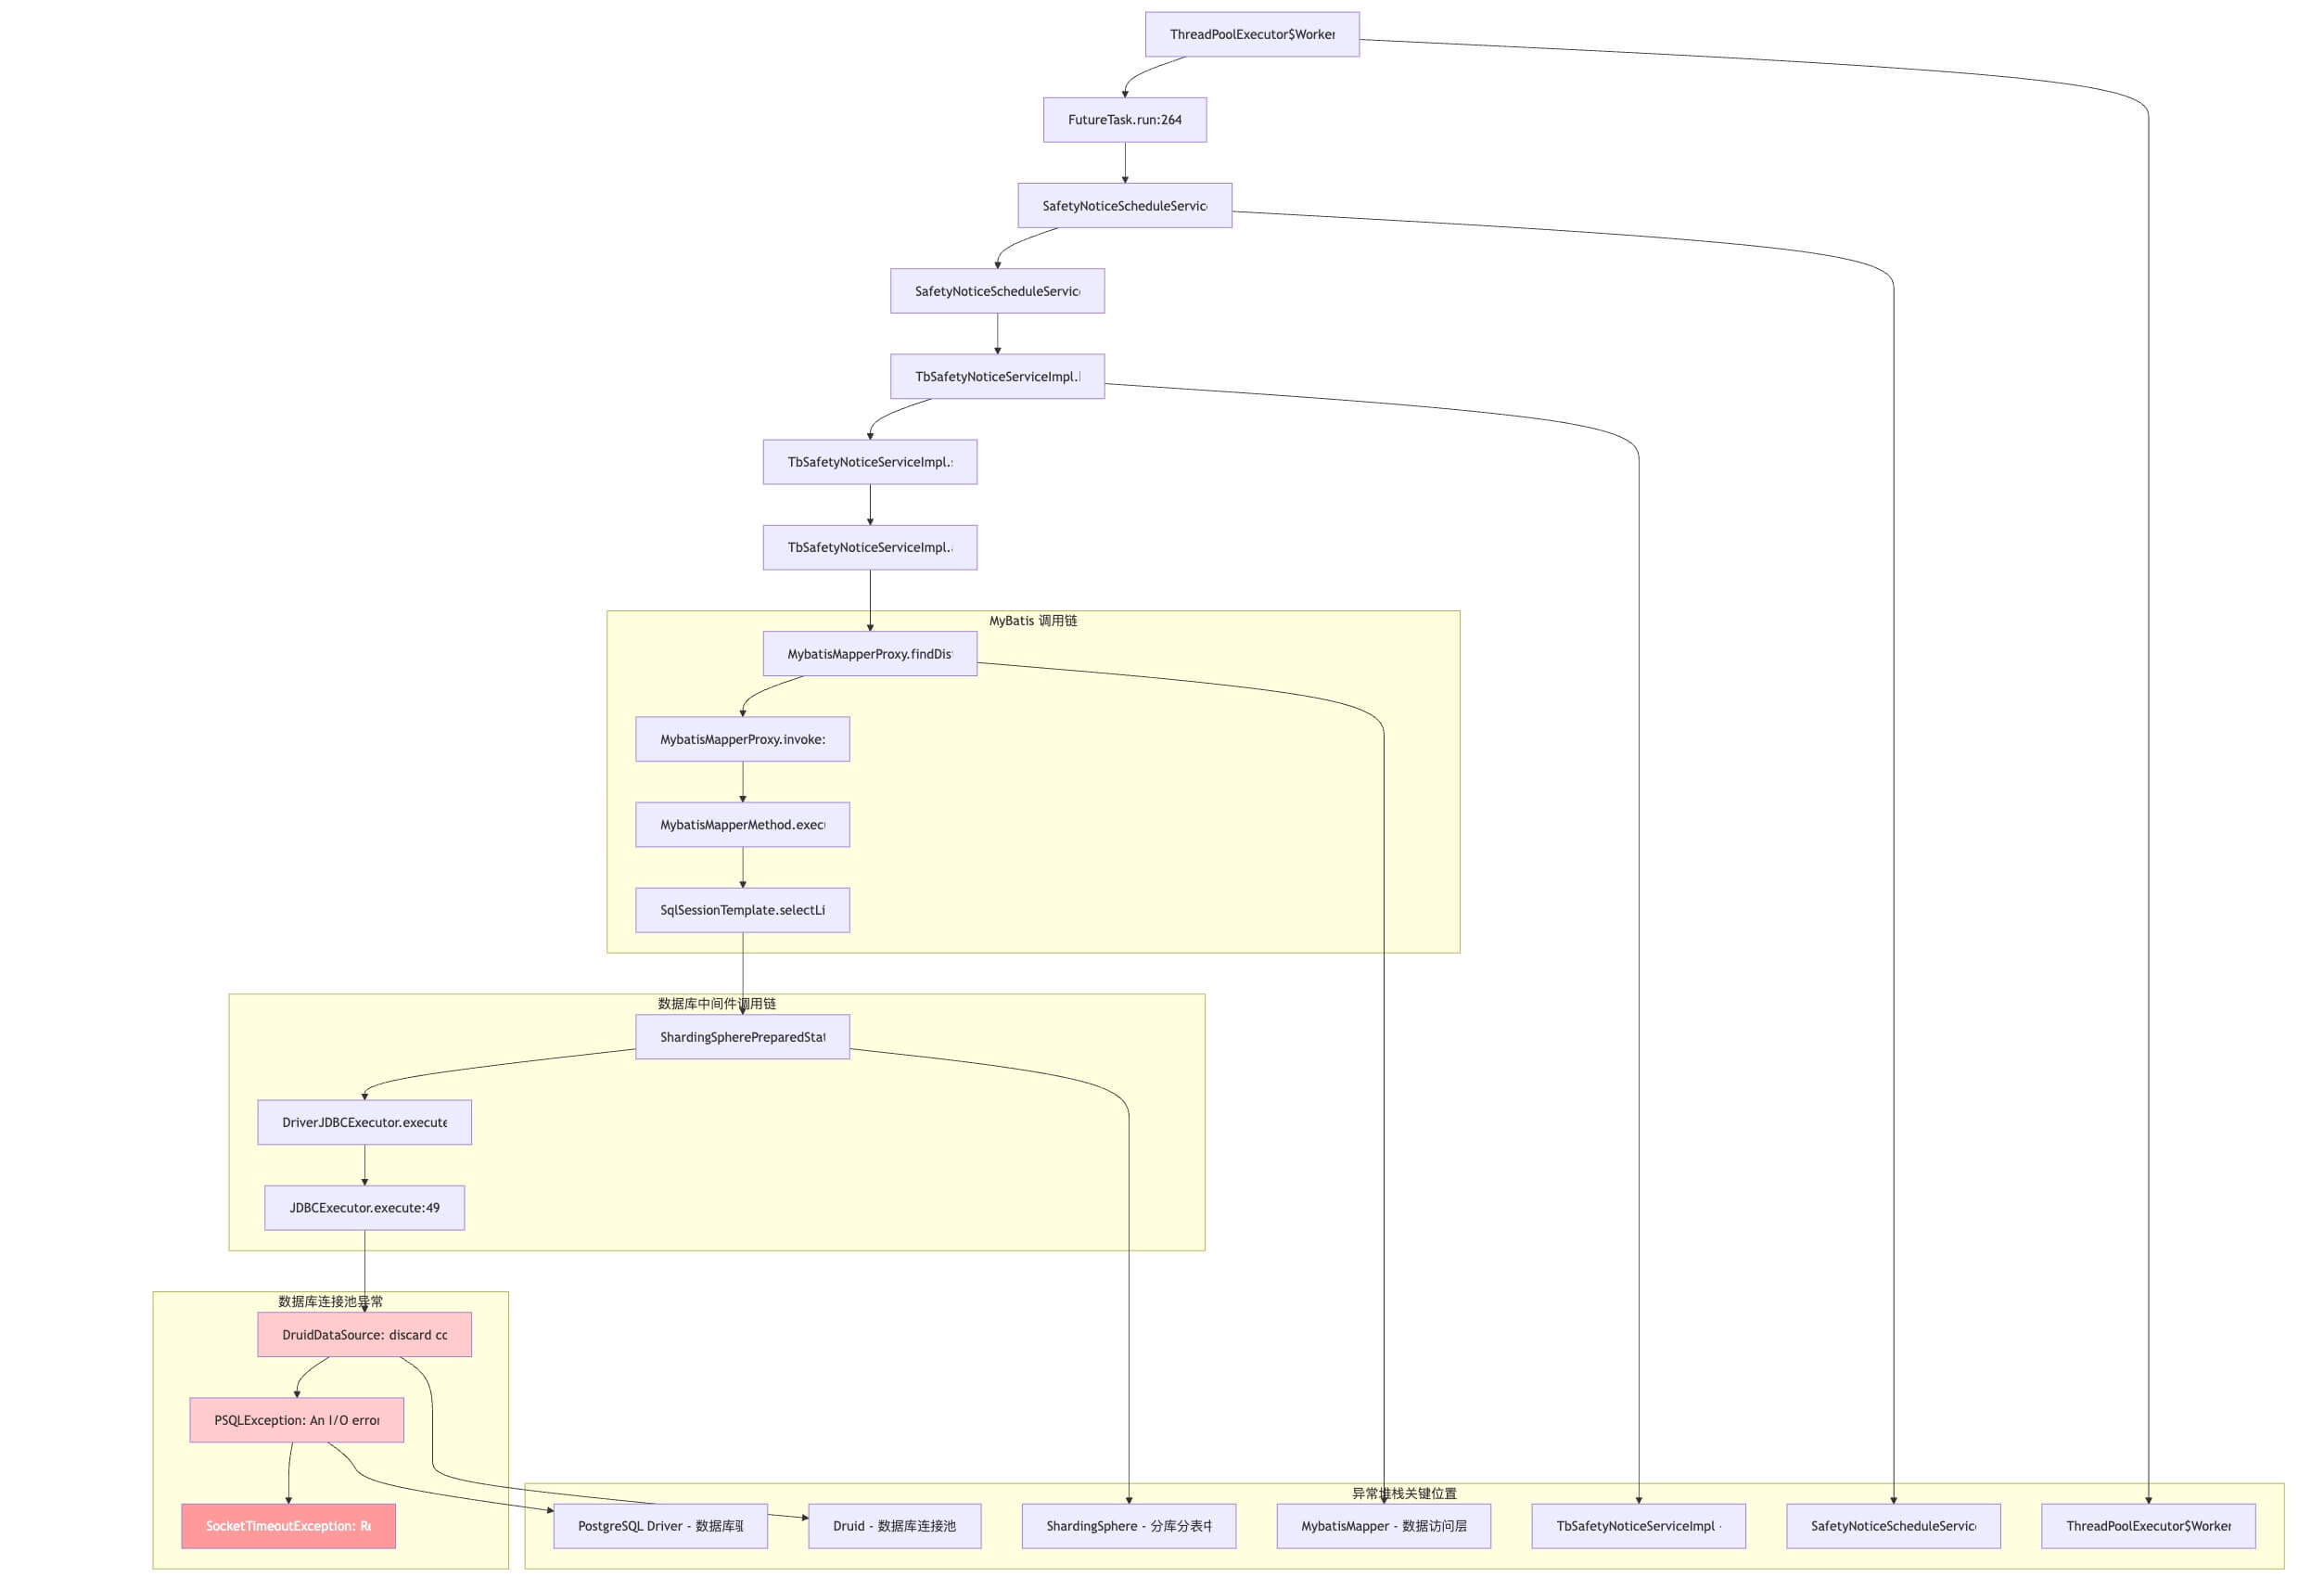
得出几个重要信息:
- 异常发生的业务代码是在批量处理”xx报告”时,查询告警处
- ShardingSphere下的连接池hikari抛出了异常Connection is closed
- Druid连接池也抛出了异常{conn-xxx} discard
- 底层SocketTimeoutException,表明是客户端等待数据库服务器的响应超时(初步判断为慢sql)
所以我开始从以下几个方面排查:
- 查业务代码的变更,为什么之前好好的跑了一个多月,突然出问题。
- 检查数据库连接参数设置
- 评估查询的数据量是否过大
- 看下HikariCP和Druid是否有啥联系以及为啥会有两个连接池?
- 查看数据库负载情况
处理过程
第一步:摸索
怀疑一切,切忌先入为主。
- 想办法重现问题
- 提前发通知,下午7点以后会操作线上系统。通常6点半以后几乎就没人用系统了。
- 因为设计该功能时,留了补偿手动,可手动重新触发报告生成。
- 反复重试了几次,问题未复现。
- 查看业务代码变更。
- 报错处业务代码owner是我,没做任何更改,所以变成重点关注addAlertData方法,也就是与告警相关(重点在数据量)
- 业务没变更但是加入了ShardingSphere(异常中也有这块的信息,先存疑)
- 检查系统连接池参数
- druid,几乎都没有做定制,都是使用的默认值。
- 使用默认值其实存在风险,应该根据业务调整一些参数,因为买的阿里的pg所以咨询了他们拿到了一份他们暴露的参数调优参考,后续可针对性修改)
- 新增的ShardingSphere的HikariCP也是使用的默认值。(异常中也有这块的信息,先存疑)
- druid,几乎都没有做定制,都是使用的默认值。
- 观察显示的数据库负载情况(阿里云的监控看板、pg的pg_stat_activity等视图、数据库日志等)
- 从视图发现确实存在执行时间较长的几条sqlsql,虽然有些慢但是不足以触发异常。慢的原因初步判断为数据量过大(报错的租户行数都在50w左右)
- 记录下这个sql,拿去控制台执行,EXPLAIN ANALYZE该sql,发现Seq Scan除了时间较长以外还存在索引问题,几乎每次查询都要用到的“告警状态”字段之前没加索引。(可能是原因之一)
- 查看数据库日志如下,这表明数据库和客户端的连接中断确实是问题的根源,可能是因为网络问题、数据库负载过高、或者连接超时等因素导致的。

第二步:验证
验证怀疑的所有点,通常控制变量法进行验证。
因为暂时没有复现,不着急先按兵不动。
- 前提是要有补偿方案,不能阻断线上使用,特别是这种核心业务。因为当时留了后门可以手动触发某个租户所以没问题。
- 虽然是线上故障同时也算严重bug,但是也不要着急,胡乱改一通,可能按下葫芦又起瓢,尽可能的找到根因,哪怕不能一次性修复。
等待了两天发现同样的问题又发生了。
- 但是这次发现了上一次遗漏的一个信息,报错的租户从日志看时间,异常都是在10s以后抛出的。(初步判断是SocketTimeout的超时时间,可能是10s)
- 拿到同样报错的sql去执行发现虽然跟之前没啥差别,问题还是那些问题,也没超过10s。(怀疑是因为报错时候执行了sql,触发了pg的缓存,所以再去查缓存生效,导致执行时间变短)
验证第一个问题:
因为当前看存在有两个连接池,查HikariCP与Druid的源码:
1
2
3
4
5
6
7
8
9
10
11
12
13
14
15
16
17
18
19
20
21
22
23
24
25
26
27
28
29
30
31
// HikariCP只有connectionTimeout为30s
static {
CONNECTION_TIMEOUT = TimeUnit.SECONDS.toMillis(30L);
VALIDATION_TIMEOUT = TimeUnit.SECONDS.toMillis(5L);
SOFT_TIMEOUT_FLOOR = Long.getLong("com.zaxxer.hikari.timeoutMs.floor", 250L);
IDLE_TIMEOUT = TimeUnit.MINUTES.toMillis(10L);
MAX_LIFETIME = TimeUnit.MINUTES.toMillis(30L);
unitTest = false;
}
// DruidDataSource初始化,socketTimeout是10s
public void init() throws SQLException {
if (!this.inited) {
DruidDriver.getInstance();
ReentrantLock lock = this.lock;
try {
lock.lockInterruptibly();
} catch (InterruptedException e) {
throw new SQLException("interrupt", e);
}
boolean init = false;
if (this.connectTimeout == 0) {
this.connectTimeout = 10000;
}
if (this.socketTimeout == 0) {
this.socketTimeout = 10000;
}
先不管HikariCP,至少能确定Druid的10s超时确实存在,因为阿里云上我开起了pg的慢sql监控,根据时间刚好查到了确实存在一条告警sql查询执行时间为10s+。
- 所以初步判断SocketTimeoutException是因为sql执行时间超过了连接池的默认超时。
- 去查了下该租户下告警的数据总数已经超过了50W,在活5000左右。
第三步:修复方案
方案如下:
- 加索引,对常用的字段“告警状态”添加索引。
- 对在活告警查询的地方分批
- 对在活主告警限制查询的条数而不是查所有。
第四步:方案执行
对所有配置分表的表,检查索引,添加必要的索引。
  -- ========================================
  -- 描述: 创建告警表的“status”字段索引
  -- 文件名: 001_create_alert_status_index.sql
  -- 作者: hht
  -- 创建日期: 2024-10-31
  -- ========================================

  DO $$
  DECLARE
      i INTEGER;
  BEGIN
      -- 遍历 tb_xx_alert_0 ~ tb_xx_alert_15
      FOR i IN 0..15 LOOP
          -- 动态生成 ALTER TABLE 语句,添加字段
          EXECUTE FORMAT('
              ALTER TABLE public.tb_xx_alert_%s
              CREATE INDEX tb_xx_alert_%s_status_index ON tb_xx_alert_%s  (status);
          ', i);
      END LOOP;
  END $$;
告警分批且限制条数
1
2
3
4
5
6
7
8
9
10
11
12
13
14
15
16
17
18
19
20
21
22
23
24
25
26
27
28
29
30
31
32
private List<AlertVO> findSubscribedAlerts(AlertSubscribedParam param) {
try {
List<List<String>> parts = PartsListUtil.getParts(param.getSubscribedCiIds(), BATCH_SIZE);
List<AlertVO> all = new ArrayList<>();
for (List<String> part : parts) {
// 分批查询
param.setSubscribedCiIds(part);
// 主告警不超过100条
Page<AlertVO> page = new Page<>(1, 100 - all.size());
IPage<AlertVO> result = tbXxAlertMapper.findSubscribedAlerts(page, param);
if (result.getTotal() == 0) {
continue;
}
// 聚合告警的子告警数据补充
getAlertAggChildren(param.getIdentityId(), result.getRecords());
all.addAll(result.getRecords());
// 如果已经达到100,退出循环
if (all.size() == 100) {
break;
}
}
// 最后统一按createTime降序排序
all.sort((a1, a2) -> Long.compare(a2.getCreateTime(), a1.getCreateTime()));
return all;
} catch (Exception e) {
String errorMessage =
String.format("查询关注告警失败: identityId=%s, deal=%s", param.getIdentityId(), param.isDeal());
log.error(errorMessage, param.getIdentityId(), e);
throw new SafetyNoticeException(errorMessage, e);
}
}
第五步:监控效果
- 上线后,连续一周到点蹲守
- SELECT pg_stat_reset(); – 重置所有统计信息
- 数据库负载看板以及pg的pg_stat_activity。
- 之前的sql执行时间没有再超过2s
- 看板上慢sql也没有在发现
- 数据库日志也没有再出现异常
- pg_stat_user_indexes+EXPLAIN ANALYZE 对应sql,查看索引使用情况。
- 业务功能正常。
看上去目前超时的问题暂时解决,但是要想更彻底的解,还需要后续对遗留项逐个解决。
遗留项/改进项
- 连接池的参数调优,虽然默认的看上去没啥问题,但是迟早肯定会出问题,记一个DFX。
- 多了一个HikariCP连接池,而且通过jconsole看了下,两个连接池都会初始化,这块是否有必要有两个连接池,这儿存在隐患,对ShardingSphere需要深入了解下,记一个DFX。
- 历史数据的清理,跟PO提出,需要加一个需求不仅仅是告警,可能还有其他数据。
- 对于核心且经常更新的表是否需要定时REINDEX